
US Tactical Asset Allocation
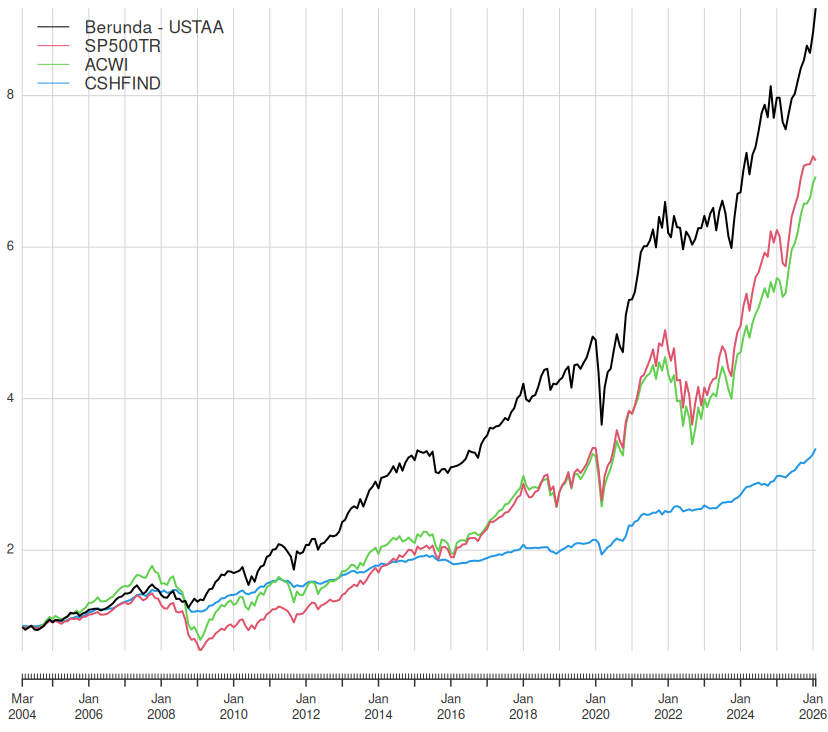
Based on our proprietary framework, the US Domestic Tactical Asset Allocation (USTAA) strategy tactically re-weights US equity sectors and other global asset classes such as bonds, gold, agricultural commodities and US Dollar index on a monthly basis. The Berunda-USTAA strategy is predominantly a long strategy with some limited shorting allowed (10-30%). Actual long/short ratios depend on our outlook of the macroeconomic environment and the probability of a bear market. The chart below shows the hypothetical fund performance side by side with major benchmarks from March 1, 2004 to February 28, 2026. Major benchmarks include S&P 500 Total Return (SP500TR), MSCI All Country World Index (ACWI) and the Credit Suisse Hedge Fund Index (CSHFIND). All benchmark and fund returns are in US Dollars. Performance assumptions include margin and borrowing rates in excess of the risk-free rate by 150 basis points, trading commissions of 0.45% or 45 basis points on all trades, slippage in time of one-day trading for friction and no explicit currency hedging.
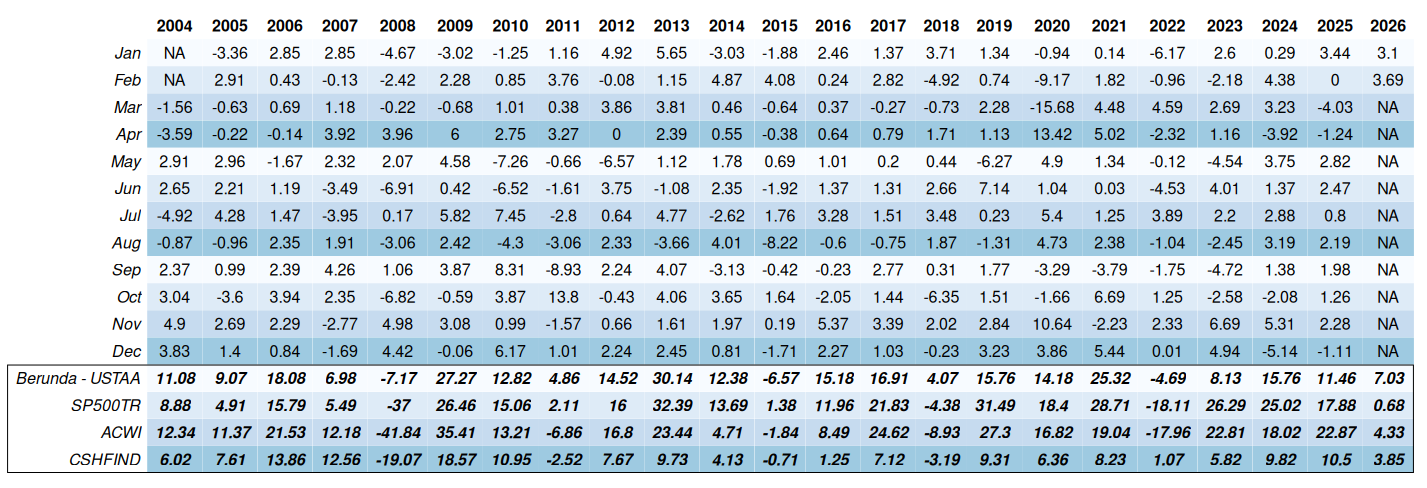
The table below the hypothetical monthly returns of Berunda US-TAA, along with side-by-side annual returns of the three benchmarks – S&P 500 Total Return (SP500TR), MSCI All Country World Index (ACWI) and the Credit Suisse Hedge Fund Index (CSHFIND) from March 1, 2004 to February 28, 2026.
Monthly Performance Returns of Berunda USTAA
Approximate Weights
As of February 28, 2026
| Sector | Weights |
|---|---|
| Materials | 0.0 |
| Energy | 6.0 |
| Financials | 12.5 |
| Technology | 20.0 |
| Communication Services | 17.0 |
| Industrials | 7.0 |
| Consumer Staples | 7.5 |
| Utilities | 2.0 |
| Healthcare | 15.5 |
| Consumer Discretionary | 1.5 |
| REITs | 0.0 |
| Gold | 5.0 |
| Agricultural Commodities | 0.0 |
| US Dollar | 0.0 |
| Cash, Short-term Treasuries & Corporate Bonds | 2.0 |
Disclosure: Backtested performance is NOT an indicator of future actual results. The results reflect the performance of a strategy not historically offered to investors and do NOT represent returns that any investor actually attained. Backtested results are calculated by the retroactive application of a model constructed on the basis of historical data and based on assumptions integral to the model which may or may not be testable and are subject to losses. General assumptions include: That the fund would have been able to purchase the securities recommended by the model and the markets were sufficiently liquid to permit all trading. Changes in these assumptions may have a material impact on the backtested returns presented. No representations and warranties are made as to the reasonableness of the assumptions. This information is provided for illustrative purposes only. Backtested performance is developed with the benefit of hindsight and has inherent limitations. Specifically, backtested results do not reflect actual trading or the effect of material economic and market factors on the decision-making process. Since trades have not actually been executed, results may have under- or over-compensated for the impact, if any, of certain market factors, such as lack of liquidity, and may not reflect the impact that certain economic or market factors may have had on the decision-making process. Further, backtesting allows the security selection methodology to be adjusted until past returns are maximized. Actual performance may differ significantly from backtested performance. Backtested results are adjusted to reflect the reinvestment of dividends and other income and, except where otherwise indicated, are presented gross-of fees and do not include the effect of backtested transaction costs, management fees, performance fees or expenses, if applicable. No cash balance or cash flow is included in the calculation.